

ECG Blog #419 — The Cause of ECG #1?
Ken Grauer, MD
MARCH 1, 2024
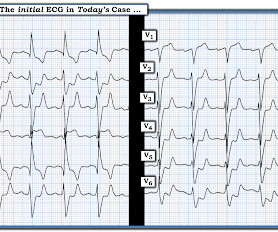
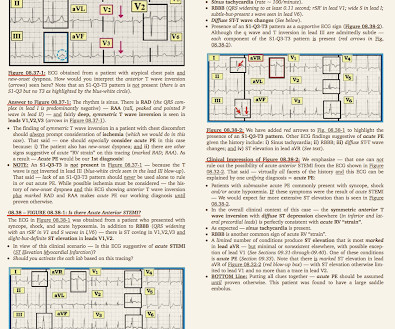
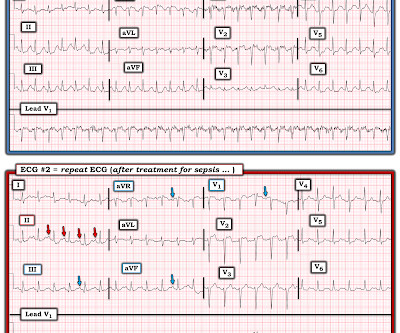
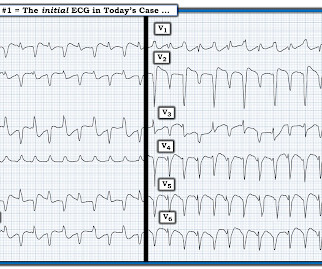
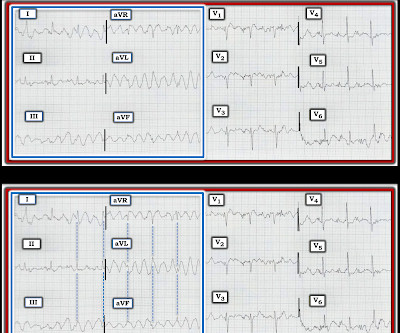
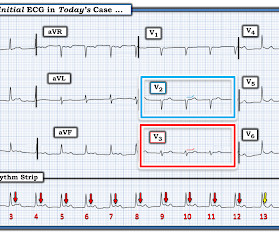
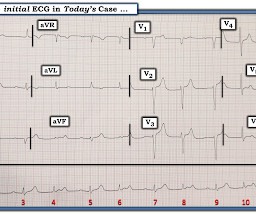
I was sent the 2 ECGs shown in Figure-1 — which were recorded from an elderly man whose heart beat "has been irregular for years". Regarding the 2 ECGs in Figure-1 : ECG #1 is the initial tracing obtained at the scene by the EMS ( E mergency M edical S ystems ) team — in association with an alert but markedly hypotensive patient.


Let's personalize your content