

ECG Blog #422 — Was Clubbing an ECG Hint?
Ken Grauer, MD
MARCH 27, 2024
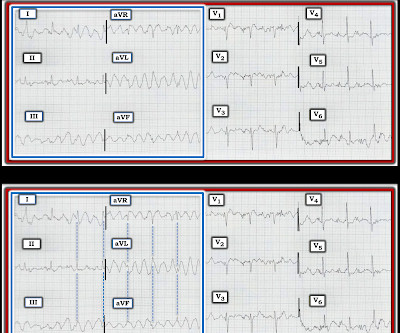
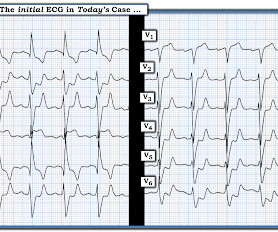
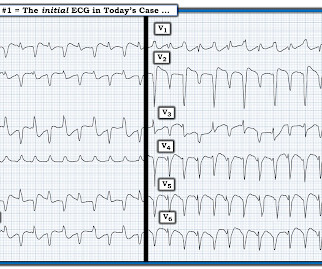
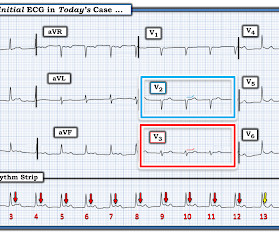
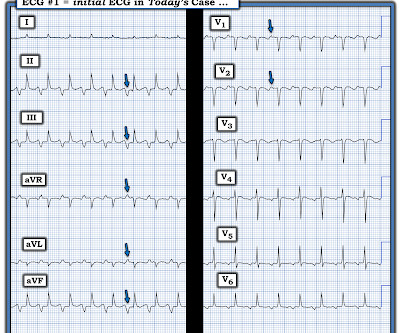
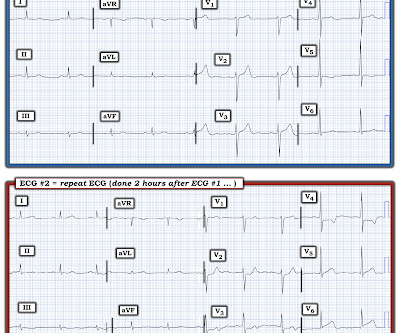
I was sent the ECG in Figure-1 — with the following history: The patient is a young man in his early 20s — who presents to the ED ( E mergency D epartment ) because of SOB ( S hortness O f B reath ) that had been ongoing for several hours. QUESTIONS: In view of the above history — How would YOU interpret the ECG in Figure-1 ?


Let's personalize your content